![]()
By Peter Rowe
STAFF WRITER
October 13, 2005
Eric Frost is a soothing presence. He speaks in soft, measured tones. Even his wardrobe favors muted colors and calm designs. You’d never guess that his life is one disaster after another.
Last December, his days were consumed by the tsunami that devastated a vast swath of southeast Asia. Since late August, he’s been busy with Hurricane Katrina. When he didn’t go to work last Sunday, his work came to him. Watching CNN in his Pacific Beach home, he learned that a massive temblor – 7.6 on the Richter scale – had hit the Kashmir region of Pakistan and India.
Back to the computerized drawing board.
“We probably started thinking about the earthquake within minutes of hearing that it had taken place,” said Frost, a geology professor at San Diego State University and co-director of the school’s Visualization Center. “That’s a normal thing for us.”
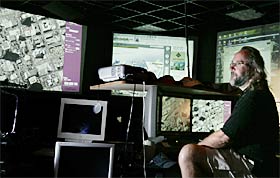
The Viz Center is a suite of windowless rooms filled with computers. In the main room, one wall is covered with three screens that, taken together, resemble a multiplex theater. That leisurely impression is heightened by the dim lighting; it’s shattered by the bustle of staffers and the beautiful but grim images flashing across the screens. These are photos shot from satellites and aircraft. The center’s mission is to turn these stunning pictures into potentially life-saving tools for doctors, firefighters, police or anyone else hurrying to a disaster site.
These sites are, too often, chaotic. Case in point: the Kashmiri region of last weekend’s earthquake.
Frost, who knows this area from geologic expeditions, doesn’t envy the task before rescuers. The population is concentrated in small villages. The villages are tucked into deep valleys. Now, many of the roads in this mountainous region are clogged with rubble. Food, water and medicine could be delivered by helicopter, but the thin air and rugged terrain make flying treacherous. Especially if pilots only have a vague notion of their destinations.
“For flying purposes, our images could be of enormous importance,” Frost noted.

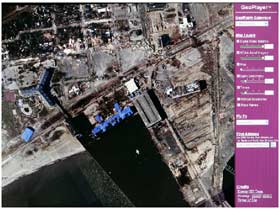
SCOTT LINNETT / Union-Tribune An aerial photo shows New Orleans several days after Hurricane Katrina. Note the beached vessel to the right of the channel and the debris on the edge of now-vacant lots.
To turn photos into pixels, and then pixels into useful information, you need someone like John Graham – “Like the cracker, only crunchier.” His graying, chest-length hair, T-shirt and shorts make the burly guy look like an aging roadie. His official title is “senior research scientist.” Unofficially, he’s a computer wizard.
The Viz Center deals in staggering, potentially discombobulating piles of data. Its Katrina files, for instance, amount to more than 20 terabytes. In other words, 20,000 gigabytes. In other words, an Everest of information that must be sifted for pebbles of fact – whether, say, someone’s home is still underwater.
Graham doesn’t mind. Heck, Graham loves this. “Watch,” he said. “This is like Google on steroids.”
He taps on a keyboard. On his computer monitor, and the multiplex screens, appears coastal Louisiana and Mississippi. Superimposed over this landscape are thousands of red rectangles. Click. The screen is filled by a single rectangle, outlining a gray-green mass of earth. Click. Larger buildings materialize along the spidery webs of major thoroughfares. Click, click. Graham drops into a Gulfport neighborhood shouldering the waterfront. He soars over a block where houses sit next to blasted, vacant concrete foundations; a boat beached a block from the water; a floating casino that has been ripped apart, most of it listing in the shallows and one fragment stalled in the middle of a street.
Click, click, click. Graham superimposes maps showing where toxic materials have been dumped. Good, if distressing, information for people who plan to rebuild here.
This level of detail is available for every stretch of the Katrina-shattered coast. But it took Graham three weeks without a break, 15 to 20 hours a day, to stitch thousands of discrete computer files into this vast quilt.
This was not a one-man job. Graham led a team of volunteers that included specialists from UC San Diego, NASA, Woods Hole, Digital Globe – a private vendor of high-resolution aerial photography – and dozens of other schools, agencies and companies.
“It’s like stone soup,” Graham said of this team of varied interests and specialties. “You never know exactly what you are going to get.”
One thing the center is getting – experience in analyzing information, experience that could be valuable during a local disaster. A wildfire, say.
The center can show you San Diego County’s hills, valleys, houses, vegetation and roads, from the broadest interstates to the narrowest goat paths. With such detailed information, much of it unavailable on maps, imagine the possibilities. “You can throw a match in virtual space and see which way the fire goes,” Graham said.
You could zoom in on a threatened canyon. You could factor in wind speed. You could calculate the density of the vegetation and the slope of the ground. And then you could figure what in blazes will happen next.
Well, maybe you couldn’t. But the Viz Center could.


