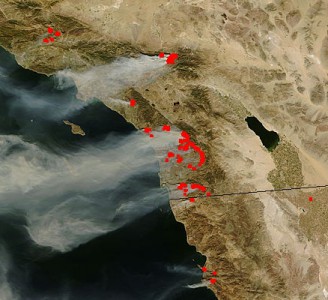
San Diego wildfires. Red pixels indicate fire activity; black horizontal line indicates the U.S.-Mexico border. (Oct. 23, 2007) © NASA/MODIS Rapid Response
San Diego, CA, November 1, 2007 — Researchers from the California Institute for Telecommunications and Information Technology (Calit2), the Visualization Center at San Diego State University (SDSU) and NASA’s Goddard Space Flight Center worked together to develop near real-time value-added, satellite-based imagery of last week’s massive and multiple wildfires in San Diego. This information was crucial to officials leading the fire response and the firefighters in the trenches, as well as the hundreds of thousands of people directly impacted by the fires.
One of the greatest needs in the recent fire storms was accurate and timely information, and frequent updates to keep up with the unusually fast-moving fires. It was crucial for the people leading the fire response and the firefighters in the trenches, as well as the hundreds of thousands of people directly impacted by the fires, to see and know where the fires were, how big they were and where they were headed.
Information about the fire storms was sought by literally millions of people locally, nationally and internationally. This presented a big problem for a Calit2 affiliate.
One of the best sources of up-to-date maps, images, and official information was the San Diego State University (SDSU) Web Fire Mapping Services. However, site responsiveness ranged from extremely slow to inoperative due to the extremely high number of hits it was receiving. “Larry Smarr suggested and authorized changing the server to the Calit2 web server complex,” said Eric Frost, a long-time Calit2 affiliate and co-director of SDSU’s Center for Information Technology and Infrastructure (CITI, home of the SDSU Visualization Center).

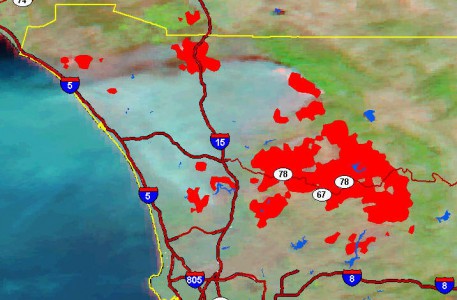
NASA MODIS satellite image, overlay with highways and fire perimeters. (Oct. 23, 2007 at 2:38 p.m. PDT) Image credit: SDSU GIS Fire Services, http://map.sdsu.edu
Frost added: “The dramatic increase in computational ability, connectivity to the Internet, and manner of serving it made the website a robust and highly available asset during the fires.” Smarr is the director of Calit2 and PI on the OptIPuter project. The mapping services site was assembled and built by SDSU’s Department of Geography, under the leadership of Prof. Ming Tsou.
Additional data was frequently posted to the website as it became available throughout each day. They also populated a second site, the San Diego 2007 Wildfires Wiki. The data and satellite imagery came from NASA (Predator, MODIS and EO-1), San Diego county, the military (P3, U2 and Global Hawk data besides numerous others) and dozens of other sources who joined in.
The Calit2 servers are being administered by Calit2 collaborator John Graham, who is the chief scientist for SDSU’s Visualization Center. Graham used the dedicated light path from SDSU to Calit2 on CENIC experimental fiber (OptIPuter) to move large amounts of data from SDSU to the Calit2 servers. The Intel servers and their architecture were changed several times as the demand increased and the files increased in size and complexity and impacted other web services on the same machines. Graham rebuilt the computers to provide different web services on several machines and collectively provide major capabilities that were served to the San Diego region and world from Calit2. Instead of being overwhelmed by the major demand for information, the pages of maps and imagery load in seconds due of the combination of hardware, connectivity, and architecture.
Timeliness is always important in emergencies and disasters, never more so than with these Santa Ana wind-driven fires, which were exceptionally quick moving. One of the most critical needs during the early stages of the fire was imagery to show where the multiple fires were and something about their intensity and the location of the smoke. Media reports and pictures of flames were compelling, but there was no way to easily compare one fire with another, or see the enormity of what was occurring.

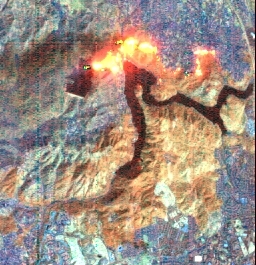
Satellite closeup visualization of the Witch Wildfire (located in northern San Diego County, just south of Escondido). The Hyperion spectrometer instrument observes 220 contiguous wavelengths of data spanning the spectrum from visible light to shortwave infrared. Using just three of the shortwave infrared channels, EO-1’s Hyperion cut through billowing smoke to reveal the burning fires located below. (Oct 23, 2007) Image credit: NASA/EO-1 Team
On Monday October 22 around noon, as the fires raced westward, Smarr emailed the Goddard MODIS and EO-1 satellite image teams within NASA to ask if it would be possible to speed up their processing of fire images so they could be used in time for fire control. And he brought them together to work directly with SDSU’s Frost and Graham, who then produced a whole series of secondary images for distribution, not just on the website, but directly to key county and city officials and the media. Several of the local TV stations immediately started using the images to show on their broadcasts, and also to plan their reporting. Smarr previously served as Chair, NASA Earth System Science & Applications Advisory Committee and as a member of the NASA Advisory Council to the NASA Administrator.
“The effort required from NASA was enormous,” said Frost, “but the end result was extremely valuable. Major credit goes to Larry. He saw where he could help and immediately jumped on it.”
The satellite imagery and secondary overlay images revealed the immense size of the Witch Creek fire in northern San Diego, as compared to other regional fires, and they helped indicate the direction it was heading and the specific areas that smoke covered the down-wind regions, such as along the coast. All of which was critically important information for tactical planning and resource allocation.

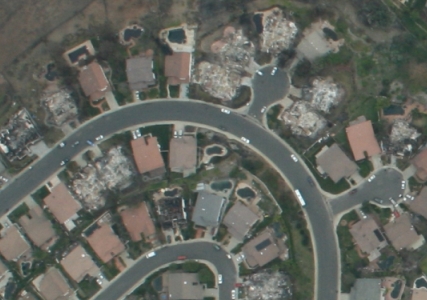
Wildfires aftermath: Aerial photo mosaic of street level shows damage on a house-by-house basis. (Oct. 26, 11 a.m.) Image credit: Rich McCreight, Near Earth Observation Systems
Frost made another effective use of the imagery by sharing the NEXRAD (Next Generation Radar for near real-time imaging of smoke reflectivity) and NASA satellite imaging with automatic fire locations plotted on Google Earth with the Tijuana Police Command Center. Mayor Kurt Honold, Sec. of Police Luis Algorri and Command Center CTO Pedro Flores were able to use these images as the basis for which to reassure the citizens of Tijuana as their city was covered with smoke from the Harris fire (which had burned into Mexico). Being able to share the imagery across the border via the Internet enabled the Tijuana leadership to use technology for the public safety of its citizens. The Police Command Center also had a video conference connection to the SDSU Viz Center, where images pulled from the Calit2 server were shared with the Tijuana leadership.
This collaboration via Calit2 between SDSU and UCSD to assist with such a massive need reflects the longstanding strong social network of Calit2 researchers working at both schools.
Related Links:
SDSU Web Fire Mapping Services
San Diego 2007 Wildfires Wiki
NASA Images of California Wildfires
OptIPuter
Related Articles
Calit2 Provides High-Tech Help During Wildfires
Media Contacts Maureen C. Curran, 858.822.4084, mcurran@soe.ucsd.edu

